The Junior SpeedLab Score
This gamified info is a full breakdown of the Junior SpeedLab Score for ages 11 and under highlighting the key categories of an athlete’s physical skills.

Innovating Athletic Development
SpeedLab aims to transform the subjective nature of athletic development with an objective data-driven approach in order to give each athlete the opportunity to achieve their athletic goals. The Junior SpeedLab Score is our pioneering assessment designed for athletes ages 11 and under to measure and track their skills, identify areas for development, and create a baseline for them to work from.
This version has been modified from our premier assessment – the SpeedLab Score – to be more age-appropriate. While the testing protocol is similar, we have utilized the data collected from over 15,000 tests to establish a scoring system appropriate for our younger athletes.
We present this key information in an accessible and comprehensive format – the scorecard.
The scorecard is designed to provide an athlete with concrete data on their overall performance, a breakdown of their individual scores, a comparison to their peers in order to objectively track current performance and continued development, and suggested development areas and training recommendations. This actionable information is key because learning and growing can only happen when the player gets feedback and is provided with clear goals.
The athlete’s scores are calculated from the raw data collected during their assessment in our technology devices and then converted into a scoring scale of 0 – 100. We applied this composite scoring system to these categories after collecting data from over 15,000 tests. This was implemented to help simplify the raw scores collected.
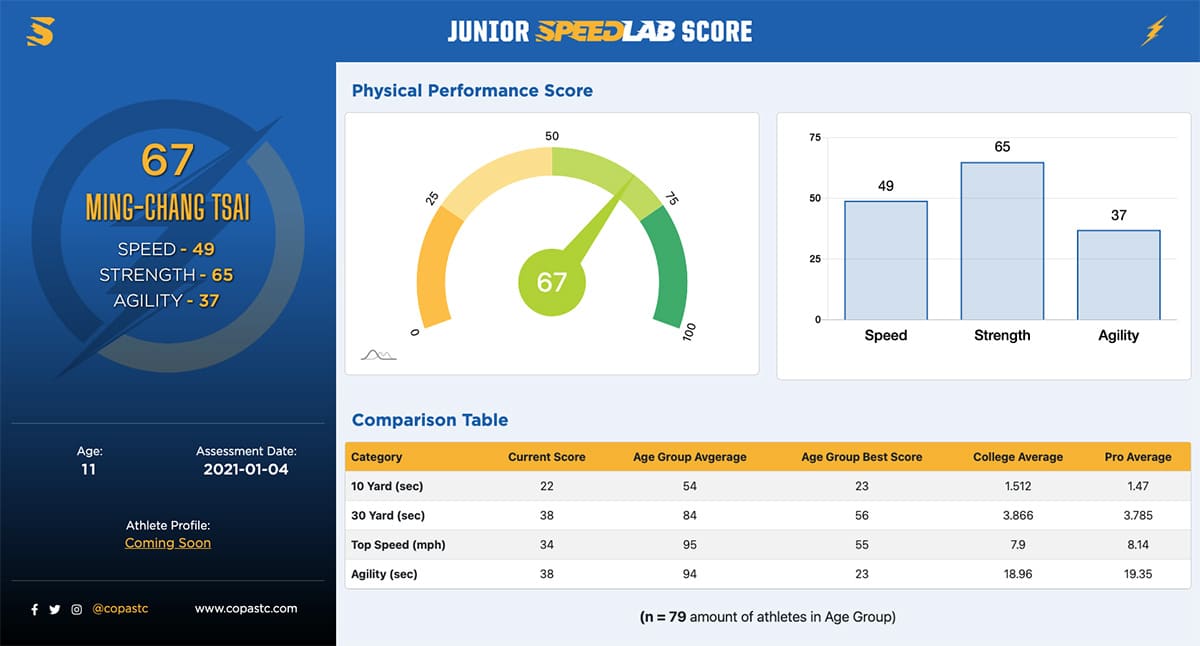
- Speed score is taken from your max sprinting speed during the 30-yard sprint.
- Strength score is taken from your 0-10-yard time achieved during the 30-yard sprint.
- *We use Strength here as success in this phase is a result of your ability to produce high amounts of force and accelerate horizontally in your first few steps.
- Agility score is taken from the reactive agility test performed on our SpeedCourt.
Our large proprietary database allows us to effectively create a composite scoring structure and compare athletes. The next section of the Scorecard takes that comparison a step further and breaks down the athlete’s performance compared to their peers.
On the bottom of the first page, you will see how you compare to other athletes of the same age and gender. This includes all of your raw scores for your 10-yard, 30-yard, top speed, and agility times. This table also provides the averages for your age group and gender as well as the top scores. If you’re looking forward and want to see how your scores measure against future competition, we have added college and professional athletes’ scores we’ve collected over the last few years.
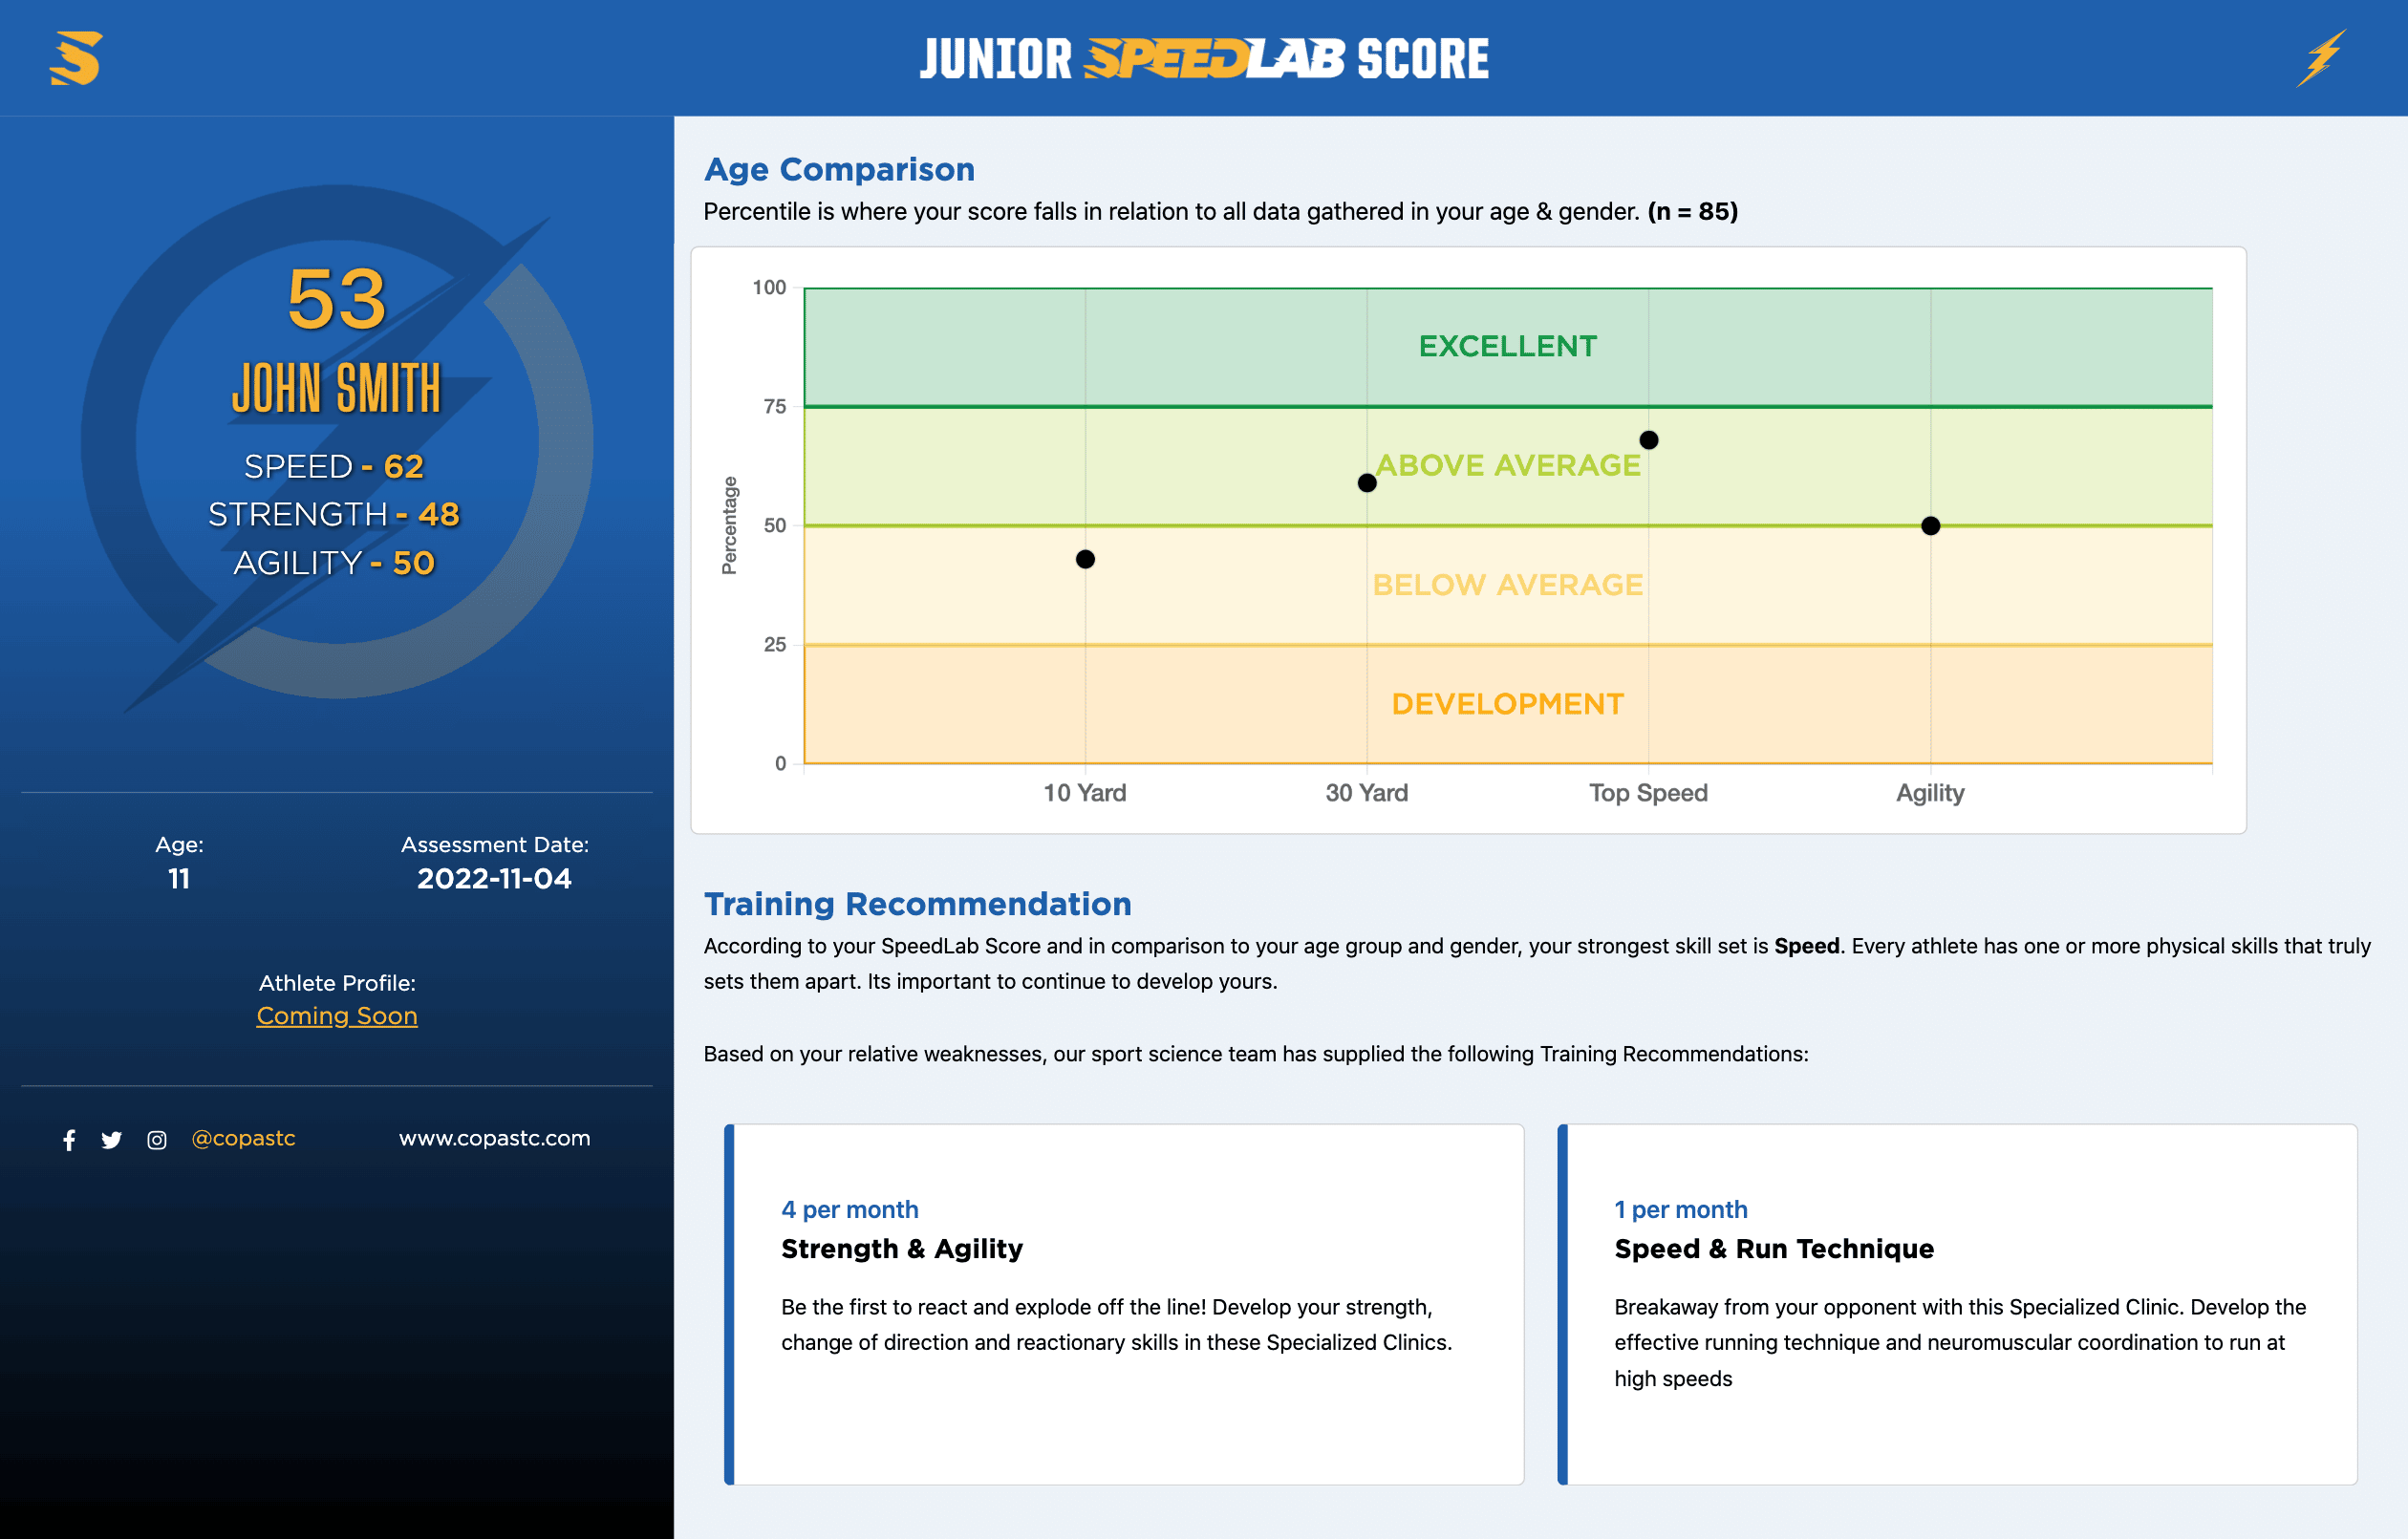
Continuing onto the second page, you will see your physical data plotted on a percentile view. (n=X) X represents the number of athletes you are being compared to, and this number will continue to grow as we continue our assessment and data collection efforts. The graph shows where your scores rank in comparison to the other athletes of the same age and gender that have also completed the Junior SpeedLab Score.
Using this example, 11-year-old John Smith scored in the 50th percentile for Agility. This means his Agility score is ranked in the top 50% for male athletes his age. His 10-yard time is ranked in around the 45th percentile. This means his 10-yard time, which is his strength score, is in the bottom 45% of all athletes his age and gender.
Training Recommendations
Once your strengths and weaknesses are identified, we can customize a development plan for you, based on your data. We provide guidance and the necessary tools to help you continue your development. There will be two recommendations based on their skills performance and two based on their physical performance.

