The Junior COPA Score – Scorecard
An engaging breakdown of the Junior COPA Score highlighting an athlete’s key soccer skills and providing insight into their strengths and weaknesses compared to their peers.

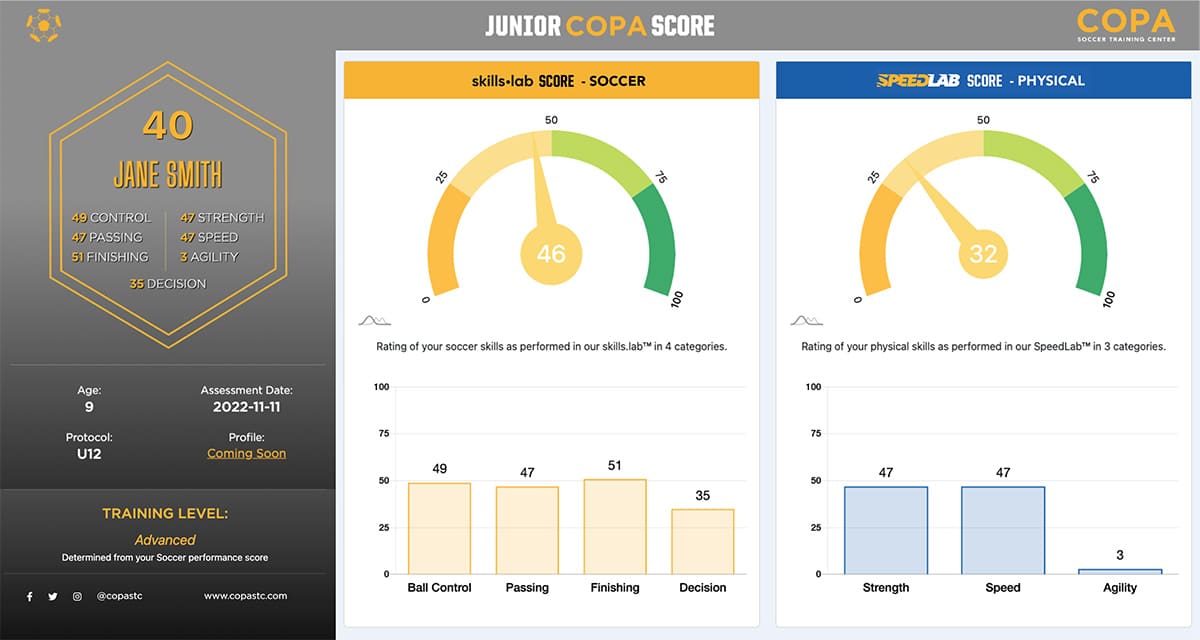
- Ball Control score is established from a variety of the exercises which assess first touch, handling time, and dribbling skills.
- Passing score is established from passing accuracy and speed of play in a variety of exercises.
- Finishing score is from the various finishing exercises assessing your shooting accuracy, power, and speed of play.
- Decision-Making score is from the majority of exercises and assesses awareness, vision, and ability to execute in chaotic game-like scenarios.
The Physical Performance Score is based on the physical scores in three categories during the SpeedLab portion of the Junior COPA Score: strength, speed, and agility. The categories receive averaged numbers, which are then averaged together to form the total score.
- Strength score is taken from your 0 – 10-yard time achieved during the 30-yard sprint. We use the word ‘strength’ here as success in this phase of the sprint is a result of your ability to produce high amounts of force and accelerate in your first few steps.
- Speed score is taken from your max sprinting speed during the 30-yard sprint.
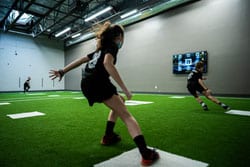
- Agility score is taken from the reactive agility test performed in our SpeedCourt.
The collection of these scores establishes the physical performance score, something each athlete should continuously look to improve over time.
These tests have been performed over 15,000 times to provide a massive database to compare each athlete. The next section of the scorecard takes that comparison a step further and breaks down the athlete’s performance compared to their peers.
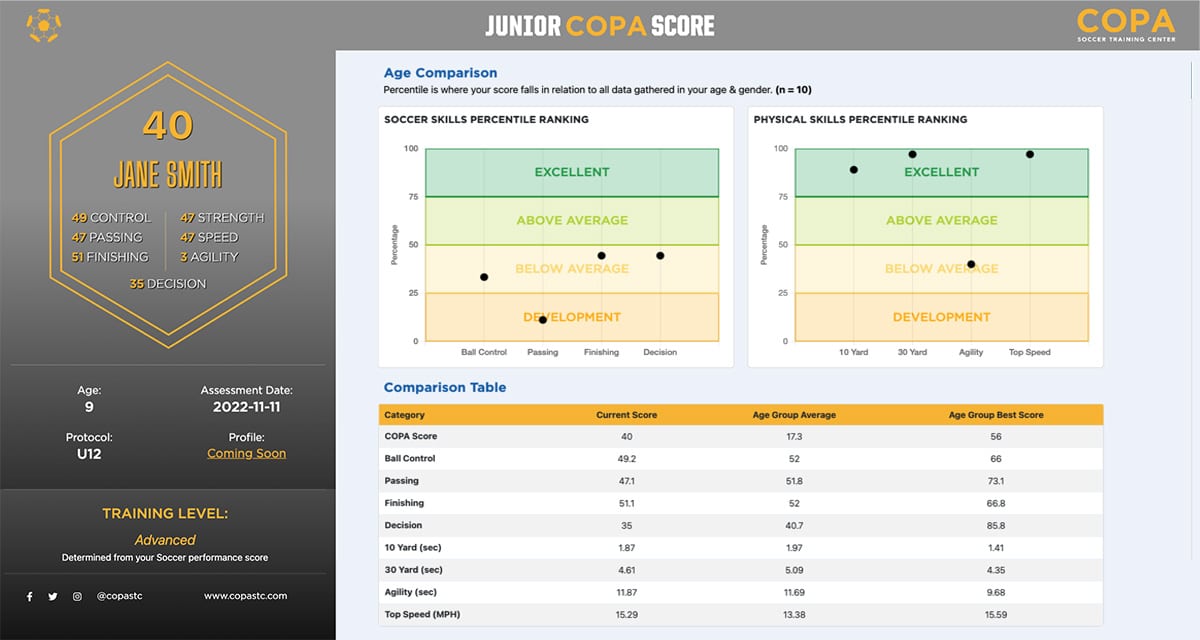
On the left graph, Jane is around the 15th percentile for Passing, meaning she is in the bottom 15% of athletes in her age and gender for this skill.
We take all the scores and compare them to other athletes of the same age and preferred gender identity. This number is represented at the top as N=x. X represents the number of peers that match the athlete. In the visual example, Jane Smith is 9 years old, so her score is compared to every other 9-year-old girl that has completed the Junior COPA Score and there have been 10 total 9-year-old girls that have completed the assessment.
This dynamic number is ever-increasing with each assessment, allowing our database to continuously grow and develop.
The comparison table at the bottom of this page provides a breakdown of the categories and how the athlete measures up against their peers.
- Current Score is the athlete’s score in each category.
- Age Group Average is the overall average score of all athletes of the same age and gender.
- Age Group Best Score is the top performance in each category based on age and gender.
The final section of the scorecard utilizes the data collected to curate personalized training recommendations based on your assessment results from our sports science team here at COPA.
Training Recommendations
